Investigations into Athlon X2 Overclocking
by Jarred Walton on December 21, 2005 12:00 PM EST- Posted in
- CPUs
Application Performance
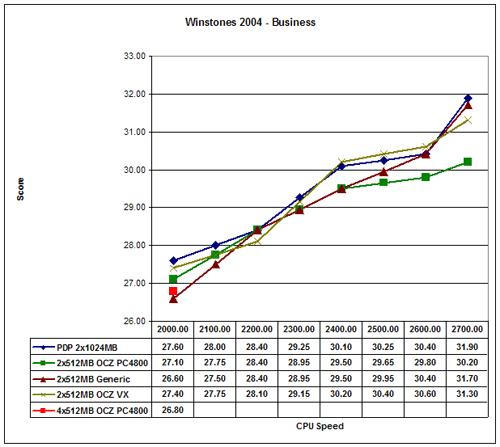
Moving on to more real-world applications, we'll start with Winstones 2004. Winstones run a bunch of scripts in a variety of applications. The problem is that many of the scripts simulate user input and operate at speeds no human can approach. Rendering an image, encoding audio or video, etc. can take time. Word, Excel, and Outlook, on the other hand, are almost entirely user-limited. While the fastest systems do perform higher, in every day use, the typical office applications are going to run so fast that differentiating between the various overclocked settings is difficult, if not impossible.
Normally (i.e. using the default settings), Winstones will defrag the hard drive, run through the script, reboot the system, and then start over. It does this five times, and the highest score is shown. Depending on your personal view, however, the reboot isn't really necessary. In fact, eliminating the reboot will generally result in higher scores on subsequent runs - a difference of as much as 15%. The Venice overclocking article allowed reboots to occur, but this time, I took that step out. The result is slightly higher scores compared to the Venice article, helped in part by the dual cores, but also by the removal of the reboots. The individual articles present comparable results, but you shouldn't directly compare the results. Honestly, Winstones isn't a terribly important measurement of performance anyway, but some people still worry about application performance.
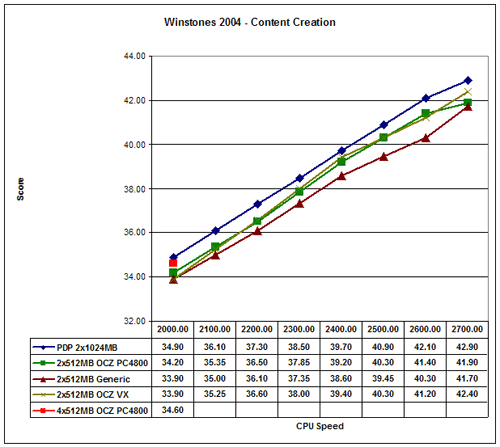
We get a decent performance increase from overclocking, but nowhere near the theoretical maximum. If you look at single-core vs. dual core performance, it's also obvious that Winstones doesn't benefit much from the addition of a second core. That's understandable, as the tests are not done in a multitasking fashion, but newer multimedia applications should show more of a performance difference. Going from 2.0 GHz to 2.7 GHz represents a 35% CPU performance increase. In the Business Winstones test, we see a range from 26.6 to 31.9, a 20% increase. The Content Creation test gives a slightly larger increase, ranging from 33.9 to 42.9 - 27% more performance. Basically, what we're seeing is that Winstones really isn't completely CPU limited.
The different memory types also have very little impact on performance. Overall, the fastest RAM configuration ended up being the 2 GB set up, but only by a small percent - well within the margin of error for Winstones. The value memory is the slowest performer, which it should be given the lower price, but the difference isn't nearly as large as some people would expect. If you're going for a relatively expensive dual core processor, the results here aren't very conclusive. Still, if you need multitasking performance, more memory is a reasonable accessory.
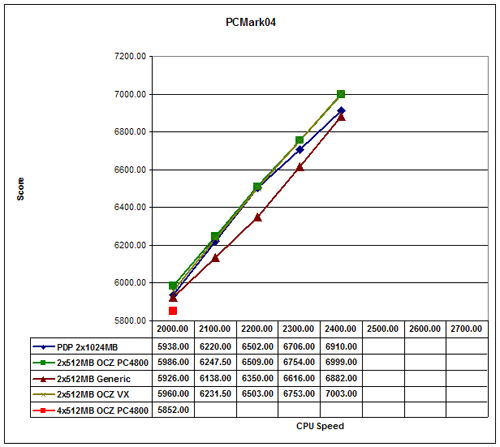
Similar in some ways to Winstones performance, PCMark attempts to gauge system performance. The results are a little more theoretical, but the simulated applications are, in many instances, more recent and will benefit more from dual cores. PCMark also includes some 2D and 3D graphics tests, which make the GPU somewhat important to the overall score. If you compare results to those of the Venice article, you'll need to take the 7800GTX impact into consideration.
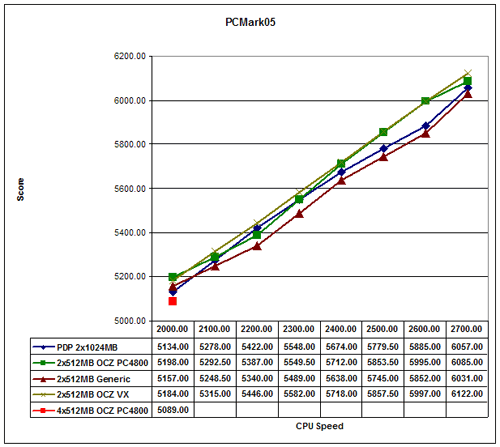
The difference between the slowest and fastest scores for our configuration is about the same as Winstones. PCMark04 goes from 5852 to 6999, a 20% increase. Unfortunately, PCMark04 was one application that consistently crashed at 2.4 GHz and above. Actually, crashed isn't the correct term; the grammar portion of the third multitasking test repeatedly failed. However, this is the only test that failed consistently above 2.4 GHz, so it's something of an anomaly. Everything appeared to run without issue, and we could get results for test 3 on its own, but we couldn't get the entire suite to complete. PCMark05 shows less of a difference, ranging from 5089 to 6101 (20%). PCMark05 also required the installation of the AMD CPU driver in order to produce acceptable scores. Without the driver installed, all HDD tests scored close to 0, severely impacting the results.
Both of the PCMark tests serve as great stress-tests of CPU overclocks, which is one of the reasons why we include the results. The issues with PCMark04 are difficult to explain, since in other testing, we have felt that PCMark05 was more strenuous. We did run all of the other tests in both PCMark products (scores not shown), and all of them passed. If we had encountered additional errors in either one, we would be more hesitant to call the 04 results into question, but for now, we're relatively confident that the 2.6 GHz overclock is stable.
In case the graphs don't convey this fact well enough, our standard application scores benefited very little from the use of higher quality RAM. The addition of a second core also didn't help a whole lot in many instances, which is generally true of real world application performance. Other tasks will definitely benefit, and the overall user experience feels smoother and faster with a dual core chip, but if you mostly just surf the web, you'll be wasting money on such a fast system.
Moving on to more real-world applications, we'll start with Winstones 2004. Winstones run a bunch of scripts in a variety of applications. The problem is that many of the scripts simulate user input and operate at speeds no human can approach. Rendering an image, encoding audio or video, etc. can take time. Word, Excel, and Outlook, on the other hand, are almost entirely user-limited. While the fastest systems do perform higher, in every day use, the typical office applications are going to run so fast that differentiating between the various overclocked settings is difficult, if not impossible.
Normally (i.e. using the default settings), Winstones will defrag the hard drive, run through the script, reboot the system, and then start over. It does this five times, and the highest score is shown. Depending on your personal view, however, the reboot isn't really necessary. In fact, eliminating the reboot will generally result in higher scores on subsequent runs - a difference of as much as 15%. The Venice overclocking article allowed reboots to occur, but this time, I took that step out. The result is slightly higher scores compared to the Venice article, helped in part by the dual cores, but also by the removal of the reboots. The individual articles present comparable results, but you shouldn't directly compare the results. Honestly, Winstones isn't a terribly important measurement of performance anyway, but some people still worry about application performance.
We get a decent performance increase from overclocking, but nowhere near the theoretical maximum. If you look at single-core vs. dual core performance, it's also obvious that Winstones doesn't benefit much from the addition of a second core. That's understandable, as the tests are not done in a multitasking fashion, but newer multimedia applications should show more of a performance difference. Going from 2.0 GHz to 2.7 GHz represents a 35% CPU performance increase. In the Business Winstones test, we see a range from 26.6 to 31.9, a 20% increase. The Content Creation test gives a slightly larger increase, ranging from 33.9 to 42.9 - 27% more performance. Basically, what we're seeing is that Winstones really isn't completely CPU limited.
The different memory types also have very little impact on performance. Overall, the fastest RAM configuration ended up being the 2 GB set up, but only by a small percent - well within the margin of error for Winstones. The value memory is the slowest performer, which it should be given the lower price, but the difference isn't nearly as large as some people would expect. If you're going for a relatively expensive dual core processor, the results here aren't very conclusive. Still, if you need multitasking performance, more memory is a reasonable accessory.
Similar in some ways to Winstones performance, PCMark attempts to gauge system performance. The results are a little more theoretical, but the simulated applications are, in many instances, more recent and will benefit more from dual cores. PCMark also includes some 2D and 3D graphics tests, which make the GPU somewhat important to the overall score. If you compare results to those of the Venice article, you'll need to take the 7800GTX impact into consideration.
The difference between the slowest and fastest scores for our configuration is about the same as Winstones. PCMark04 goes from 5852 to 6999, a 20% increase. Unfortunately, PCMark04 was one application that consistently crashed at 2.4 GHz and above. Actually, crashed isn't the correct term; the grammar portion of the third multitasking test repeatedly failed. However, this is the only test that failed consistently above 2.4 GHz, so it's something of an anomaly. Everything appeared to run without issue, and we could get results for test 3 on its own, but we couldn't get the entire suite to complete. PCMark05 shows less of a difference, ranging from 5089 to 6101 (20%). PCMark05 also required the installation of the AMD CPU driver in order to produce acceptable scores. Without the driver installed, all HDD tests scored close to 0, severely impacting the results.
Both of the PCMark tests serve as great stress-tests of CPU overclocks, which is one of the reasons why we include the results. The issues with PCMark04 are difficult to explain, since in other testing, we have felt that PCMark05 was more strenuous. We did run all of the other tests in both PCMark products (scores not shown), and all of them passed. If we had encountered additional errors in either one, we would be more hesitant to call the 04 results into question, but for now, we're relatively confident that the 2.6 GHz overclock is stable.
In case the graphs don't convey this fact well enough, our standard application scores benefited very little from the use of higher quality RAM. The addition of a second core also didn't help a whole lot in many instances, which is generally true of real world application performance. Other tasks will definitely benefit, and the overall user experience feels smoother and faster with a dual core chip, but if you mostly just surf the web, you'll be wasting money on such a fast system.


46 Comments
View All Comments
Puddleglum - Wednesday, December 21, 2005 - link
Neermind.. read this in the closing thoughts:"There is one other point to mention on the memory: overclocking with four 512MB DIMMs was almost a complete failure on the setup that we used. Other motherboards, or perhaps a BIOS update for this motherboard, might improve the results, but for now we would recommend caution with such attempts. If you want to run 2GB of RAM, two 1GB DIMMs would be a much better choice."
Good info.
bobsmith1492 - Wednesday, December 21, 2005 - link
Actually, switching supply efficiencies can change dramatically with load; I wouldn't count on the draw at the wall as a good indicator of system load change. The efficiency may change from, say 70% at half-load to 85% at 3/4 load, which, on a 400 watt supply, would show up as: 285.7 watts draw (lower power) and 352.9 watts draw (high power). Now, the system is drawing 50% more power, while the meter is only showing 23.5% more power draw.Something to keep in mind anyway as I don't know exactly what the difference in efficiency for that particular supply is....
Cerb - Wednesday, December 21, 2005 - link
It would be nice to know. However, if it's like the 470w one, it is 'close enough' at all loads.http://www.silentpcreview.com/article173-page4.htm...">http://www.silentpcreview.com/article173-page4.htm...
bobsmith1492 - Wednesday, December 21, 2005 - link
Yeah, from 2-400W it's pretty close. Nevermind me then. :)WRXSTI - Wednesday, December 21, 2005 - link
I cannot wait to get a 64 X2 chip! Maybe by next year is better...Futurebobis - Thursday, December 1, 2022 - link
Yo, sup past people