AMD's Radeon HD 5870: Bringing About the Next Generation Of GPUs
by Ryan Smith on September 23, 2009 9:00 AM EST- Posted in
- GPUs
AA Image Quality & Performance
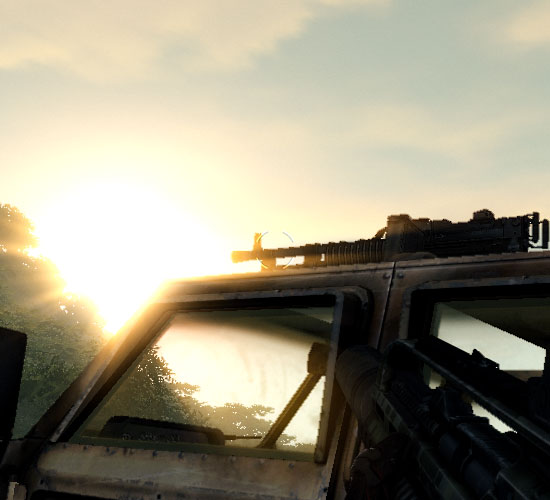
With HL2 unsuitable for use in assessing image quality, we will be using Crysis: Warhead for the task. Warhead has a great deal of foliage in parts of the game which creates an immense amount of aliasing, and along with the geometry of local objects forms a good test for anti-aliasing quality. Look in particular at the leaves both to the left and through the windshield, along with aliasing along the frame, windows, and mirror of the vehicle. We’d also like to note that since AMD’s SSAA modes do not work in DX10, this is done in DX9 mode instead.
|
AMD Radeon HD 5870
|
AMD Radeon HD 4870
|
NVIDIA GTX 280
|
| No AA | ||
| 2X MSAA | ||
| 4X MSAA | ||
| 8X MSAA | ||
| 2X MSAA +AAA | 2X MSAA +AAA | 2X MSAA + SSTr |
| 4X MSAA +AAA | 4X MSAA +AAA | 4X MSAA + SSTr |
| 8X MSAA +AAA | 8X MSAA +AAA | 8X MSAA + SSTr |
| 2X SSAA | ||
| 4X SSAA | ||
| 8X SSAA |
From an image quality perspective, very little has changed for AMD compared to the 4890. With MSAA and AAA modes enabled the quality is virtually identical. And while things are not identical when flipping between vendors (for whatever reason the sky brightness differs), the resulting image quality is still basically the same.
For AMD, the downside to this IQ test is that SSAA fails to break away from MSAA + AAA. We’ve previously established that SSAA is a superior (albeit brute force) method of anti-aliasing, but we have been unable to find any scene in any game that succinctly proves it. Shader aliasing should be the biggest difference, but in practice we can’t find any such aliasing in a DX9 game that would be obvious. Nor is Crysis Warhead benefitting from the extra texture sampling here.
From our testing, we’re left with the impression that for a MSAA + AAA (or MSAA + SSTr for NVIDIA) is just as good as SSAA for all practical purposes. Much as with the anisotropic filtering situation we know through technological proof that there is better method, but it just isn’t making a noticeable difference here. If nothing else this is good from a performance standpoint, as MSAA + AAA is not nearly as hard on performance as outright SSAA is. Perhaps SSAA is better suited for older games, particularly those locked at lower resolutions?
For our performance data, we have two cases. We will first look at HL2 on only the 5870, which we ran before realizing the quality problem with Source-engine games. We believe that the performance data is still correct in spite of the visual bug, and while we’re not going to use it as our only data, we will use it as an example of AA performance in an older title.
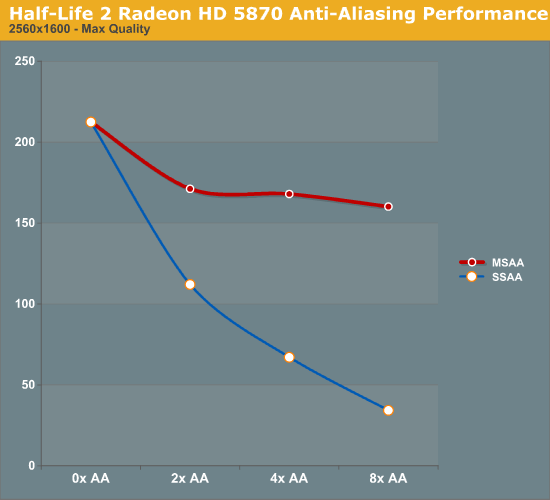
As a testament to the rendering power of the 5870, even at 2560x1600 and 8x SSAA, we still get a just-playable framerate on HL2. To put things in perspective, with 8x SSAA the game is being rendered at approximately 32MP, well over the size of even the largest possible single-card Eyefinity display.
Our second, larger performance test is Crysis: Warhead. Here we are testing the game on DX9 mode again at a resolution of 1920x1200. Since this is a look at the impact of AA on various architectures, we will limit this test to the 5870, the GTX 280, and the Radeon HD 4890. Our interest here is in performance relative to no anti-aliasing, and whether different architectures lose the same amount of performance or not.
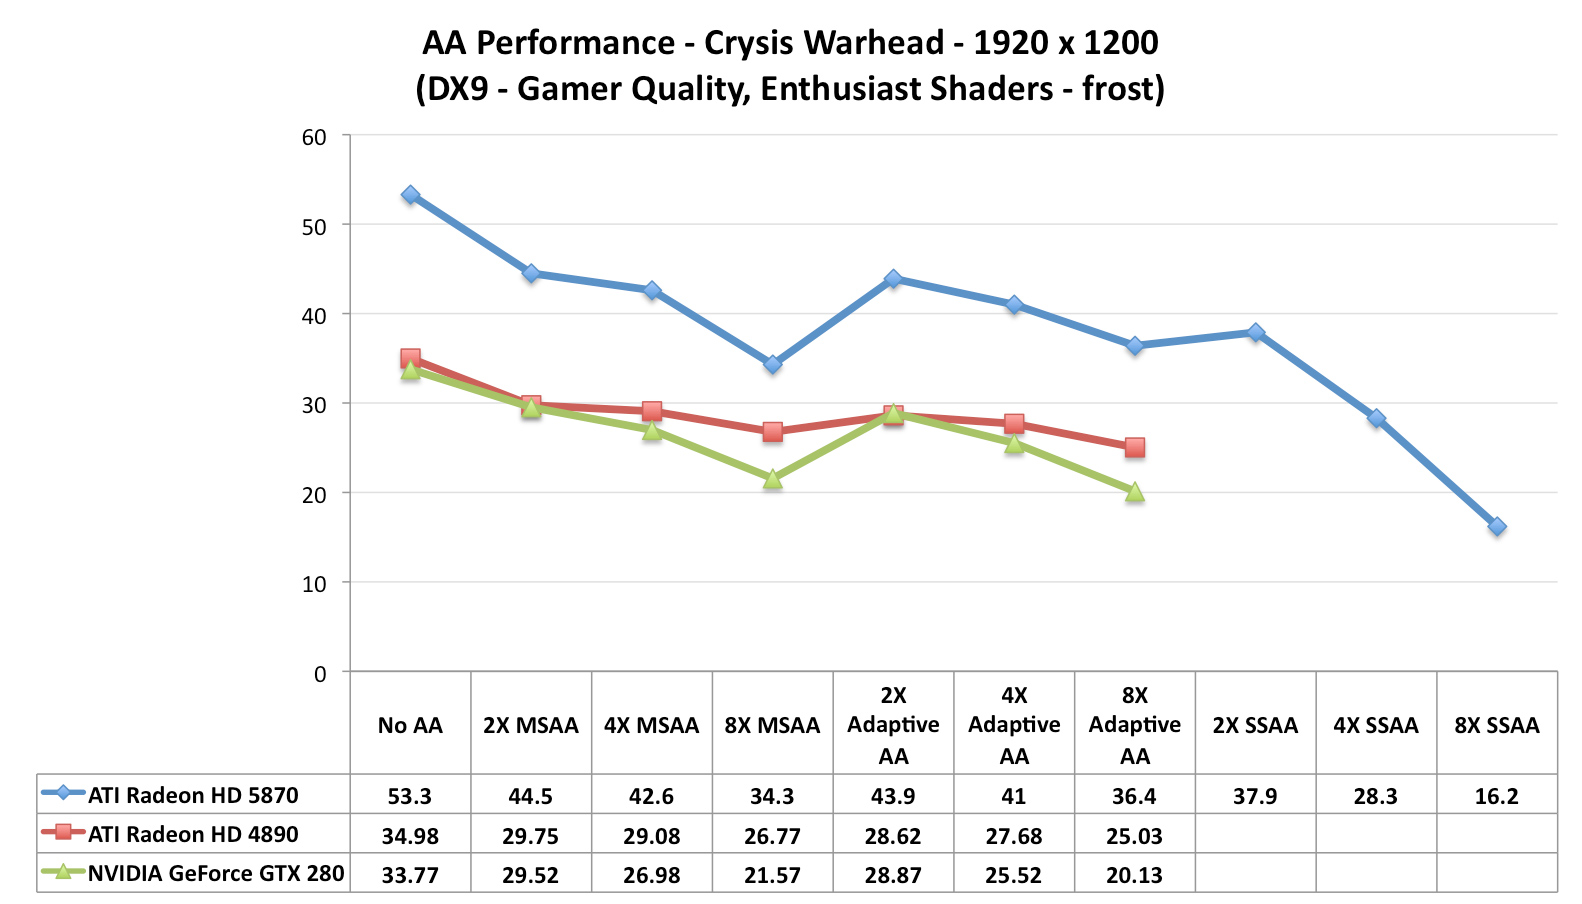
Starting with the 5870, moving from 0x AA to 4x MSAA only incurs a 20% drop in performance, while 8x MSAA increases that drop to 35%, or 80% of the 4x MSAA performance. Interestingly, in spite of the heavy foliage in the scene, Adaptive AA has virtually no performance hit over regular MSAA, coming in at virtually the same results. SSAA is of course the big loser here, quickly dropping to unplayable levels. As we discussed earlier, the quality of SSAA is no better than MSAA + AAA here.
Moving on, we have the 4890. While the overall performance is lower, interestingly enough the drop in performance from MSAA is not quite as much, at only 17% for 4x MSAA and 25% for 8x MSAA. This makes the performance of 8x MSAA relative to 4x MSAA 92%. Once again the performance hit from enabling AAA is miniscule, at roughly 1 FPS.
Finally we have the GTX 280. The drop in performance here is in line with that of the 5870; 20% for 4x MSAA, 36% for 8x MSAA, with 8x MSAA offering 80% of the performance. Even enabling supersample transparency AA only knocks off 1 FPS, just like AAA under the 5870.
What this leaves us with are very curious results. On a percentage basis the 5870 is no better than the GTX 280, which isn’t an irrational thing to see, but it does worse than the 4890. At this point we don’t have a good explanation for the difference; perhaps it’s a product of early drivers or the early BIOS? It’s something that we’ll need to investigate at a later date.
Wrapping things up, as we discussed earlier AMD has been pitching the idea of better 8x MSAA performance in the 5870 compared to the 4800 series due to the extra cache. Although from a practical perspective we’re not sold on the idea that 8x MSAA is a big enough improvement to justify any performance hit, we can put to rest the idea that the 5870 is any better at 8x MSAA than prior cards. At least in Crysis: Warhead, we’re not seeing it.


327 Comments
View All Comments
Agentbolt - Wednesday, September 23, 2009 - link
Informative and well-written. My main question was "how future-proof is it?" I got the Radeon 9700 for DirectX9, the 8800GTS for DirectX10, and it looks like I may very well be picking this up for DirectX11. It's nice there's usually one card you can pick up early that'll run games for years to come at acceptable levels.kumquatsrus - Wednesday, September 23, 2009 - link
great article and great card btw. just wanted to point out that the gtx 285 also had 2x6 pins only required, i believe.Ryan Smith - Wednesday, September 23, 2009 - link
That's correct. I'm not sure how "275" ended up in there.SiliconDoc - Wednesday, September 23, 2009 - link
One wonders how the 8800GT ended up on the Temp/Heat comparison, until you READ the text, and it claims heat is "all over the place", then the very next line is "ALL the Ati's are up @~around 90C" .Yes, so temp is NOT alkl over the place, it's only VERY HIGH for ALL the ATI cards... and NVIDIA cards are not all very high...
-so it becomes CLEAR the 8800GT was included ONLY so the article could whine it was at 92C, since the 275 is @ 75C and the 260 is low the 285 is low, etc., NVidia WINS HANDS DOWN the temperature game...... buit the article just couldn't bring itself to be HONEST about that.
---
What a shame. Deception, the name of the game.
Ryan Smith - Wednesday, September 23, 2009 - link
The 8800GT, as was the 3870, was included to offer a snapshot of an older value product in our comparisons. The 8800GT in particular was a very popular card, and there are still a lot of people out there using them. Including such cards provides a frame of reference for performance for people using such cards.SiliconDoc - Wednesday, September 23, 2009 - link
Gee I cannot imagine load temps for the 4980 and 4870x2 exist anywhere else on this site along with the 260,275, and 285... can you ?Oh, how about I look...
Finally - Wednesday, September 23, 2009 - link
Nvidida-Trolls tend to turn green when feeling inferior.SiliconDoc - Wednesday, September 23, 2009 - link
Turning green was something the 40nm 5870 was supposed to do wasn't it ?Instead it turned into another 3D HEAT MONSTER, like all the ati cards.
Take a look at the power charts, then look at that "wonderful tiny ATI die size that makes em so much money!" (as they lose a billion plus a year), and then calculate that power into that tiny core, NOT minusing failure for framerates hence "less data", since of course ati cards are "faster" right ?
So you've got more power in a smaller footprint core...
HENCE THE 90 DEGREE CELCIUS RUNNING RATES, AND BEYOND.
---
Yeah, so sorry that it's easier for you to call names than think.
RubberJohnny - Wednesday, September 23, 2009 - link
LOL...replying to your own post 3 times...gettin all worked up about temps...PUTTIN STUFF IN CAPS...Looks like this fan boy just can't accept that the 5890 is a great card. Not surprising really, these reviews always seem to bring the fanboys/trolls/whackos out of the woodwork.
Once again, good job AT!!!
JarredWalton - Thursday, September 24, 2009 - link
SiliconDoc, you should try thinking instead of trolling. Why would the maximum be around 90C? Because that's what the cards are designed to target under load. If they get hotter, the fan speeds would ramp up a bit more. There's no need to run fans at high rates to cool down hardware if the hardware functions properly.Reviewing based on max temperatures is a stupid idea when other factors come into play, which is why one page has power draws, temperatures, and noise levels. The GTX 295 has the same temperature not because it's "as hot" but because the fan kicked up to a faster speed to keep that level of heat.
The only thing you can really conclude is that slower GPUs generate less heat and thus don't need to increase fan speeds. The 275 gets hotter than the 285 as well by 10C, but since the 285 is 11.3 dB louder I wouldn't call it better by any stretch. It's just "different".